Plot Sepals and Petals in Iris
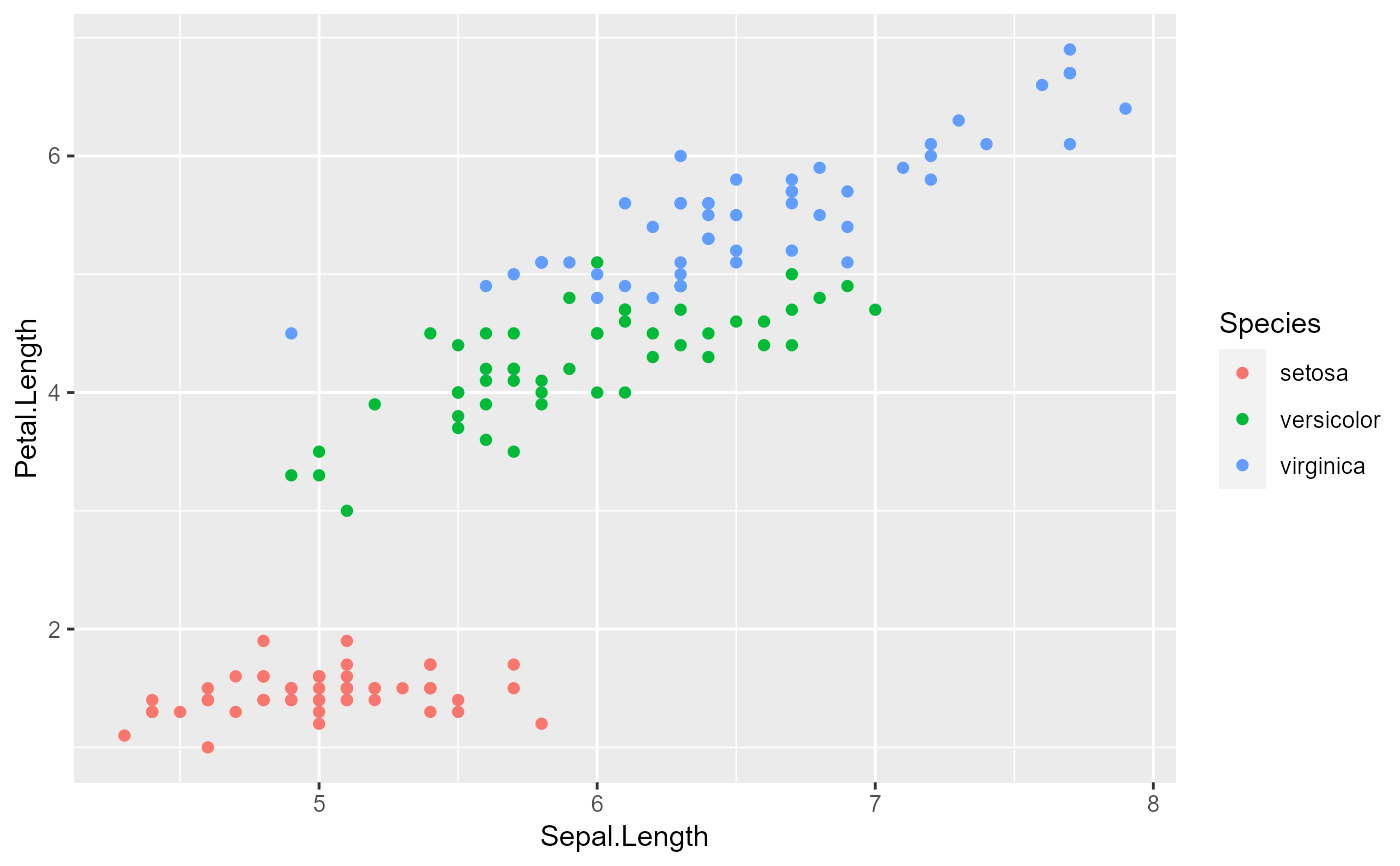
sepals_and_petals.RdThis function can plot any of the numeric columns in the iris dataset against each other.
sepals_and_petals(x, y)
Arguments
| x | value in |
|---|---|
| y | value in |
Value
ggplot object
Examples
sepals_and_petals("Sepal.Length", "Petal.Length")# Code sepals_and_petals#> function(x, y) { #> ggplot(datasets::iris, aes_string(x = x, y = y, color = "Species")) + #> geom_point() #> } #> <environment: namespace:SepalsAndPetals>
